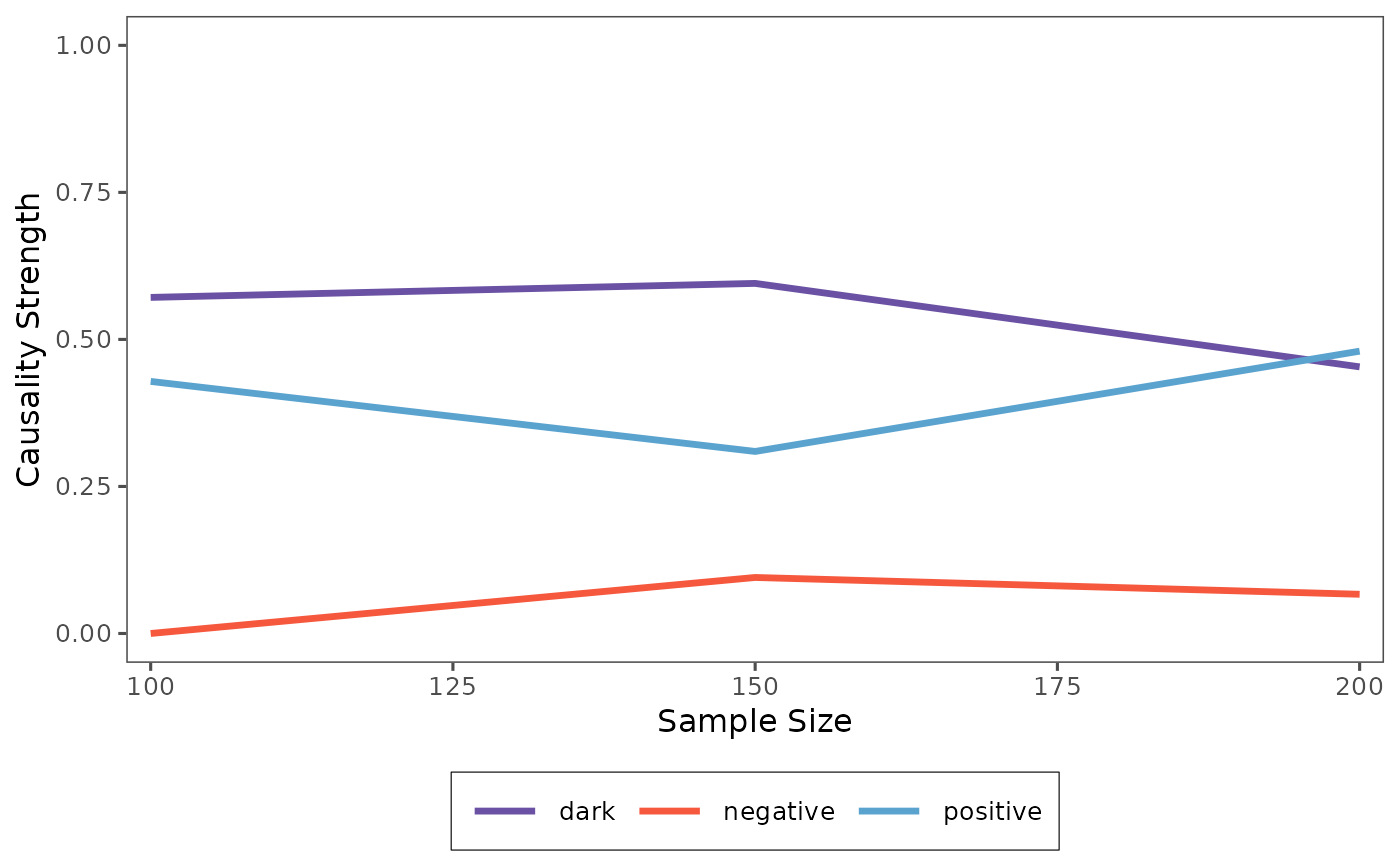
Visualizes the pattern causality cross-validation results. This function generates a line plot showing the causality strengths for different sample sizes.
Usage
# S3 method for class 'pc_cv'
plot(x, fr = FALSE, separate = FALSE, ...)Examples
data(climate_indices)
X <- climate_indices$AO
Y <- climate_indices$AAO
numbersets <- c(100, 150, 200)
cv_results <- pcCrossValidation(X, Y, 3, 2, "euclidean", 1, FALSE, numberset = numbersets)
plot(cv_results)
#> Warning: Using `size` aesthetic for lines was deprecated in ggplot2 3.4.0.
#> ℹ Please use `linewidth` instead.
#> ℹ The deprecated feature was likely used in the patterncausality
#>   package.
#>   Please report the issue at
#>   <https://github.com/pattern-causality/pattern_causality/issues>.
#> Warning: The `size` argument of `element_rect()` is deprecated as of ggplot2
#> 3.4.0.
#> ℹ Please use the `linewidth` argument instead.
#> ℹ The deprecated feature was likely used in the patterncausality
#>   package.
#>   Please report the issue at
#>   <https://github.com/pattern-causality/pattern_causality/issues>.